
Decision Driven-Data Collection Culture
- Mar 8, 2024
- 10 min read
Updated: Mar 8, 2024
ED 6380 - Spec Topics in Ed Tech

As I reflect on this semester's learnings, I found two areas that moved my interest and which I felt needed to dedicate more time and delve even deeper into these areas for career choice reasons. My fascination for learning gets triggered when I encounter success stories, such as the case study presented by Bambrick-Santoyo (2010) and his involvement with the North Star Academy Charter School of Newark, N.J. His successful introduction and implementation of a data-driven instruction model was inspirational, to say the least, and demonstrated what a collective body of minds could accomplish with the right dose of leadership and perseverance. While I found Paul Bambrick-Santoyo’s work incredible, I wanted to study further and investigate his implementation strategies of a data-driven instruction model to identify core values that drove this model to full fruition.
Furthermore, since data-driven instruction entails the collection and utilization of data to drive teacher instruction, pivot, and do reassessments, revising teaching strategies to align with students’ learning gaps and needs, I wanted to replicate this model in a Head Start setting. Also, it would be very useful to integrate the concept of big data into the student learning process, along with continuous assessments in the classrooms. It would be beneficial if the concept of big data were utilized to identify how schools are integrating technology to support teachers, focusing primarily on the type of tools teachers receive given the enormous amounts of student data that are being collected as part of an assessment process and which they need to decipher and make useful meaning for their purpose.
Finally, I will be integrating these questions and weaving them into the world of Early Head Start and Head Start, a federally funded early childhood program that grew out of the “War on Poverty” programs initiated by President Lyndon B. Johnson. With a core mission of serving the most disadvantaged and high-risk children in the country, the vision of Head Start was to bring holistic services laser-focused on children 0-5 years of age. Early Head Start and Head Start programs have started to incorporate technology and embraced the concept of data-driven instruction and service delivery as part of the early childhood education programs, but there is much work still to be done.
Decision-driven data collection is one of the most important learning themes covered in this semester’s class and one that I felt was so impactful for what I want to do professionally or plan to do in educational classrooms in public schools or early childhood education programs like Head Start. Paul Bambrick-Santoyo’s success story in planning and implementing a decision-driven data collection model at North Star Academy Charter School of Newark, N.J., opened my mind to the possibilities of “what could be” for the future of individualized student learning in public school classrooms or Head Start if it could truly be supported by quality and relevant student information or data that could enhance teacher instruction. As a lifelong learner, I feel that we should not only learn from our mistakes but also borrow from others who have demonstrated success in our field of education. Therefore, it was worth exploring the case of North Star Academy Charter School of Newark, N.J., and other charter schools, breaking down the building blocks that made decision-driven data collection and implementation such a radical and rewarding success for their students.
I believe that decision-driven data collection is the first and foremost important step teachers need to take in planning impactful lesson strategies that align with the rigor of state standards and student needs for mastering these benchmarks so they can successfully engage in these state-mandated summative assessments. Decision-driven data collection, defined by McKean (2020), relates to all the data available to teachers via their Student Information System (SIS), Learning Management System (LMS), assessment tools, and whatever other relevant student information is available, etc. Teachers engage in data analysis, along with assistance from whatever variation of a school leadership team in place, working together to narrow and extrapolate the information useful to ascertain student mastery of the lessons presented (progress) but also, with laser focus, identifying the learning gaps or level of mastery attained for those areas. Lessons that were not mastered satisfactorily, as measured against the pre-set teacher-developed benchmarks, are crucial in the teaching process so that they can be identified, and remedial action taken to mitigate the impact on the student. Afterward, the teachers must know when to pivot, utilize assessment data, and make the necessary teaching adjustments by developing revised strategies focused primarily on student learning gaps consistent with the data analysis process. However, I want to take a step back and review where and how all this student information is collected and integrated through technology and made available to teachers. Ploth (2017) says that “to learn what our students need and how we can better design our lessons to prepare them, we use formative and summative assessments, which are vital in determining what learning has occurred, what areas need to be reinforced, and define the teacher’s next steps (action plans). She further implies that this kind of information guides teacher instruction and, thus, gives additional learning opportunities to students, and for teachers, assessments give them the updated required information to provide teacher feedback to students, guide their learning, and revise or set new goals.
In Head Start and Early Head Start, my last place of work for more than five years was with a non-profit organization that provided early childhood education services to children 0-5 years; I will endeavor to share how we use data in a student learning process. With a legislative mandate, the Head Start program's mission changed in 2007, creating a paradigm shift in how children are prepared before entering public schools. At my workplace, we adopted a research-based curriculum resource called Creative Curriculum and paired it with the Teaching Strategies Gold, a child database that provides education staff with the technological tools that assist in the strategic collection of classroom data, so the collection process is individualized per student, and entered in the Teaching Strategies Gold child database daily for the entire nine months of school.
This Early Head Start and Head Start program, which I will refer to as the ECE Program, collected and has been utilizing data to determine student progress against benchmarks pre-set by the state and local school districts where this ECE program resides. Knowing what I know now about assessments, the ECE program's quarterly benchmarks equated to summative assessments, and measures to determine knowledge acquisition were done only three times a school year (November, March, and May). Daily, weekly, and monthly individualized child progress notes were entered into the TS Gold software database. This database was the holding place of all child information used to determine a child’s progress aligned to local school district and state standards. Head Start child instruction was done via a generic curriculum template for all students but aligned to what ECE refers to as “child outcome measures.” The teachers were responsible for utilizing individualized child information collected from conversations with parents or gathered during intake or through other means such as “individualized education plans for children 3-5 years of age” and “family individualized education plans for children 0-3 years old”. The teachers incorporated all this child data into TS Gold and created individualized plans of instruction that were developmentally appropriate for the children's ages and which were also aligned to local school district and state standards. The Head Start Early Learning Outcomes Framework (HSELOF): Ages Birth to Five (HSELOF, 2015) presents five broad areas of early learning, referred to as central domains (See Figure 1)
FIGURE 1: DOMAIN ORGANIZATION
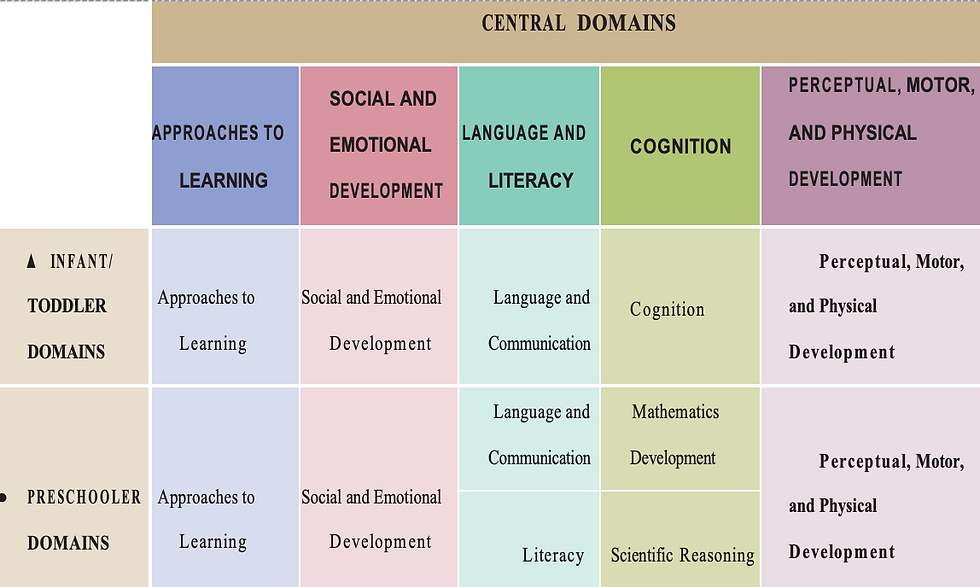
These domains reflect research-based expectations for learning and development goals for student learning. The HSELOF emphasizes the key skills, behaviors, and knowledge that programs must foster in children ages birth to 5 to help them succeed in school and life. (HSELOF 2015) The Framework, in combination with the teacher’s knowledge and understanding of each child’s cultural background, ensures that children’s unique ways of learning are recognized. (HSELOF 2023)
Below is a sample of the annual HS Quarterly Child Outcome Reports that includes all three reporting periods: the Fall Report, 2022; Winter Report, 2023; and Spring Report, 2023.
Number of Children: Fall Checkpoint – 431; Winter Checkpoint - 462; Spring Checkpoint -
450; Number of Classrooms: 28
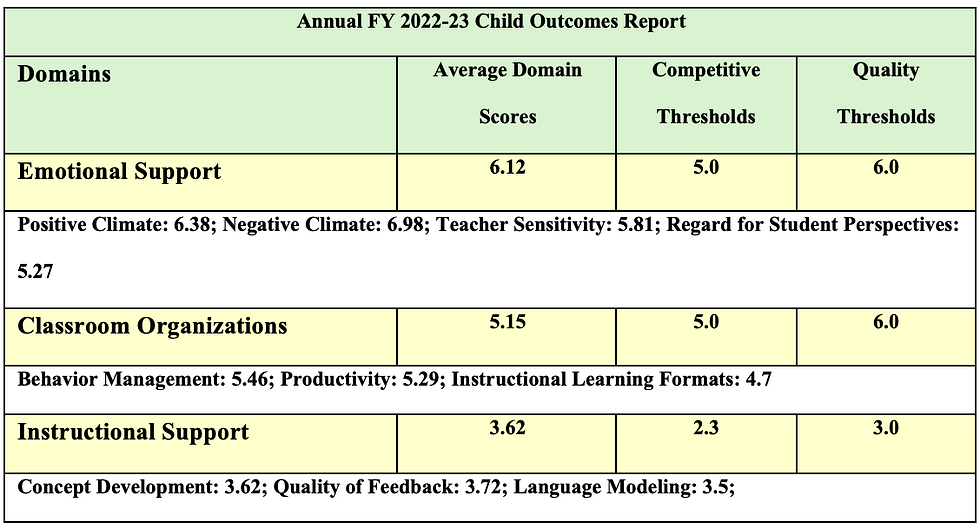
Figure 2: FY 2022-23 Child Outcomes Report (Source: Kids Are First, Inc.)

The Classroom Assessment and Scoring System (CLASS) observation was conducted in 28 Pre-K classrooms (children ages 0-5). Teachers and children were observed over two cycles of 20 minutes each. The observations occurred between 9:00 AM and 11:30 AM. The classroom observed the three primary CLASS domains of Emotional Support, Classroom Organization, and Instructional Support. This report provides the results by Domain and Dimensions. The CLASS rating scale is based on a low (1,2), medium (3,4,5) and high (6,7) range.
As communicated above, Kids Are First, Inc. collected the child outcome data over the nine-month school year period, with teachers doing individualized data entry into the TS Gold child database for every child in the classroom from August 2022 to November 2022 (1st Benchmark), then December 2022 to February 2023 (2nd Benchmark) and finally, March 2023 to May 2023 (3rd Benchmark). In TS Gold, the program entered the local school district and/or state standards, and the child data was measured up and compared against these standards. All the data for all 28 classrooms was entered for the nine months, with reporting periods every three months (December 2022, March 2023, and May 2023). The data in Figure 2 above was from the August 2022 to May 2023 school year for Head Start children 3-5 in 28 classrooms, and the Early Head Start children 0-3 in 22 classrooms is not reflected in this statistical presentation.
Widely Held Expectations 2022-2023 - The report is based on three different checkpoints: Fall 2022 (blue color), 431 children; Winter 2023 (orange color), 462 children; and Spring 2023 (green color), 450 children, as shown in Figure 3.
According to Figure 3, all the expectations were exceeded, and there were percentage increases in the following domains:
1. Approaches to Learning: There was an increase of 18.91% from fall to winter and an additional 8.86% increase from spring to winter, resulting in a total increase of 27.77%.
2. Social and Emotional Development: There was an increase of 14.49% from fall to winter and an additional 13.49% increase from spring to winter, resulting in a total increase of 27.96%.
3. Language and Communication: There was an increase of 18.98% from fall to winter and an additional 11.14% increase from spring to winter, resulting in a total increase of 30.12%.
4. Mathematics Development: There was an increase of 17.7% from fall to winter and an additional 8.84% increase from spring to winter, resulting in a total increase of 26.54%.
5. Scientific Reasoning: There was an increase of 4.86% from fall to winter and an additional 4.51% increase from spring to winter, resulting in a total increase of 9.37%.
6. Perceptual, Motor, and Physical Development: There was an increase of 16.38% from fall to winter and an additional 10.49%, resulting in a total increase of 26.87%.
7. The highest increase was observed in Language and Communication, which increased by 30.12%.
Annual Child Outcomes Report - The CLASS rating scale ranges from 1 to 7, with 1 and 2 being low, 3 to 5 being medium, and 6 and 7 being high. The Annual Child Outcomes Report highlights the average domain scores as follows: Emotional Support has an average of 6.12, Classroom Organization has an average domain score of 5.15, and Instructional Support has an average domain score of 3.62.
In my closing remarks, I just want to point out that Early Head Start and Head Start do not yet have sophisticated data software options that can used similarly to LSM (Learning Management System), such as CANVAS or other software that public schools use for this purpose. Also, I just wanted to briefly talk about one more topic that was part of my semester’s learning. I was introduced to the opportunity to design learning outcomes/standards. I designed a quiz with multiple questions that aligned with pre-set student outcomes and entered the data in the software Canvas for analysis. This assignment gave me a better understanding of how classroom lesson outcomes are preplanned and the lesson objectives entered in Canvas, assisting teachers in identifying students' mastery of the lessons and areas where they may need further support and/or understanding.
In Early Head Start and Head Start, teachers don’t have these types of analysis tools where they can set up teaching structures with embedded learning objectives, enabling instantaneous individualized reports that provide valuable data on the level of mastery achieved by each student. The only child database program available to Early Head Start and Head Start is Teaching Strategies Gold or equivalent software if other programs are using different variations of the same type of child database systems. I also know that resources are limited for many of these non-profits operating 0-5 programs, especially for nuances such as data, data collection, and data management. This field of data collection and utilization for student quality improvement is quite new for Early Head Start and Head Start programs and sometimes very misunderstood on how quality can be achieved. Most Early Head Starts and Head Starts may have one staff directing the entire Early Childhood Education Service Area, and that includes curriculum and the rest of the early childhood education implementation of program activities. Therefore, the lack of time just exacerbates this phenomenon or the lack of creativity to take data collection seriously and put them into actions that can take children’s learning to a new level.
Another major challenge I discovered during this exercise was the lack of appropriate training and technical assistance available to those responsible for managing the data and ensuring that education staff understand how to extract individualized reports from these child databases. This could be accomplished by working with software companies to develop standardized reporting that gives additional tools to teachers to extrapolate data into useful reports. Also, Early Head Start and Head Start have multiple computer literacy issues among the teaching staff. Great teachers with many years of experience are now being asked to utilize technology in more sophisticated ways, and they don’t have the computer skills to get this done. Even when offered training, some of these teachers simply don’t want to apply themselves and upgrade their computer literacy skills necessary to be effective in meeting the new expectations in their classrooms. Therefore, like most schools in the country, Early Head Start and Head Start are losing a lot of good staff in this post-pandemic era because of the changing expectations in the classroom driven by the introduction of technology.
After reviewing Canvas, I saw the advantages of using a Learning Management System that can provide instantaneous data, which is key to providing feedback and other types of assistance to students. On the downside, understanding databases, their structure, and setting up the parameters for what you want to extract is a process that involves intensive training, and the learning curve can sometimes be significant, depending on the computer literacy skills of the teachers. Therefore, if Early Head Start and Head Start are going to transition to a decision-driven data collection and implementation system, there must be a commitment and resources allocated to provide ongoing training, mentoring, and technical assistance to all education staff. The teacher learning curve will vary based on previous experience working in databases and extracting and creating reports. My final point on the subject, any student database program that generates real-time progress information is useful if appropriate actions to mitigate these gaps, but there must be a long-term commitment and patience from the public schools and early childhood education programs to nurture such a system, allow for trial and error, and tweak it as many times as necessary so that it gets institutionalized and made a part of the school's operational DNA.
Additional Resources:
References
Bambrick-Santoyo, P. (2010). Driven by Data: A Practical Guide to Improve Instruction.
McKean, Justin (2020) 7 Steps for Making Data-Driven Decision in Education, Data Analytics, Personalized Learning, Assessment, PowerSchool. https://www.powerschool.com/blog/7-steps-for-making-data-driven-decision-in-education/
Ploth, Rachelle (2017) How I Got Started Using Technology to Assess Student Learning, TeachThought Staff. https://www.teachthought.com/technology/how-i-got-started-using-technology-to-assess-student-learning/
Figure 1 (2023) Head Start Early Learning Outcomes Framework, School Readiness, Head Start Early Childhood Learning & Knowledge Center, https://eclkc.ohs.acf.hhs.gov/school-readiness/article/head-start-early-learning-outcomes-framework
Figure 2 (2023) FY 2022-23 Child Outcomes Report, Kids Are First, Inc., Funded through a grant by the U.S. Health and Human Services, Aid to Children and Families, Head Start Office.
Comments